Coming to AppSource
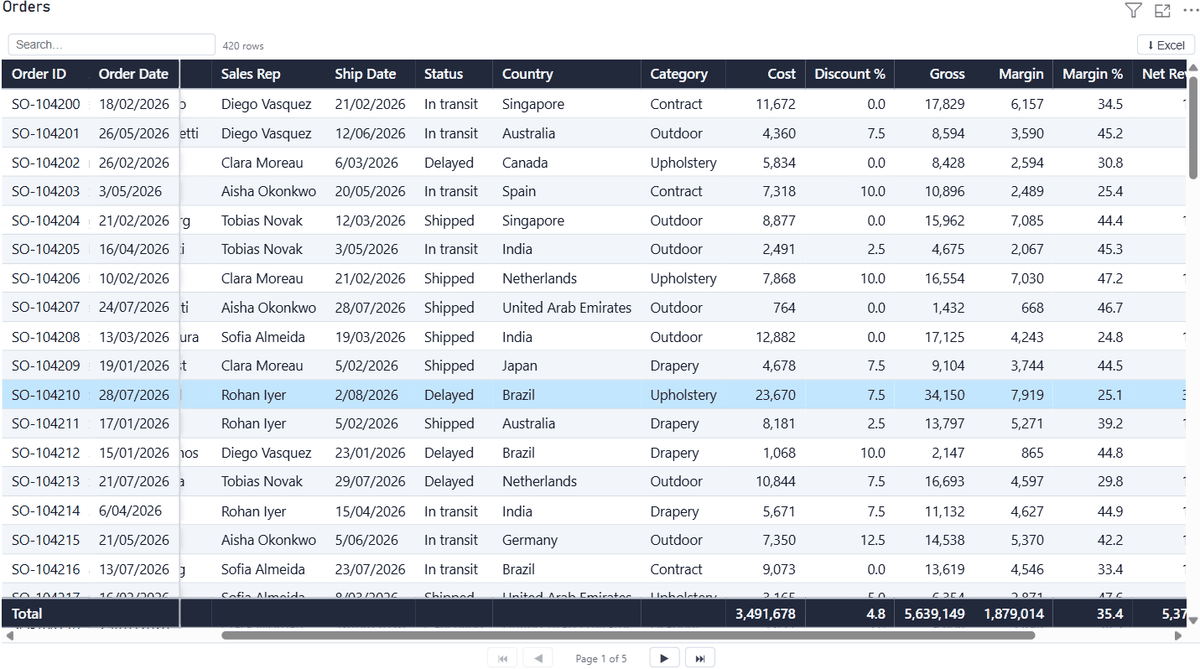
Pro Table
The table Power BI should have shipped with: frozen columns, sticky totals, pagination, search, per-column formatting, conditional formatting, and one-click Excel export.
PBIStack builds professional custom visuals and tooling for Power BI — made by people who run enterprise reporting for a living, for people who do the same. No external services, no per-viewer licences, and no silent guessing about your data.
Custom visuals
Each one exists because the native visual stops where real reporting begins.
The table Power BI should have shipped with: frozen columns, sticky totals, pagination, search, per-column formatting, conditional formatting, and one-click Excel export.
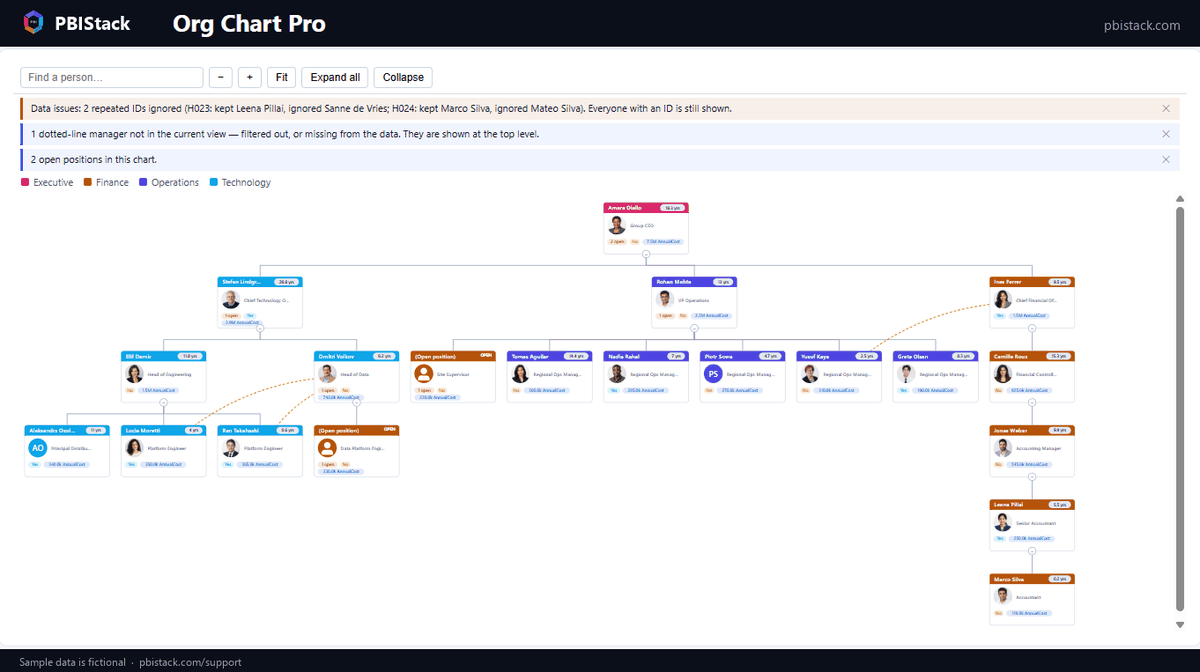
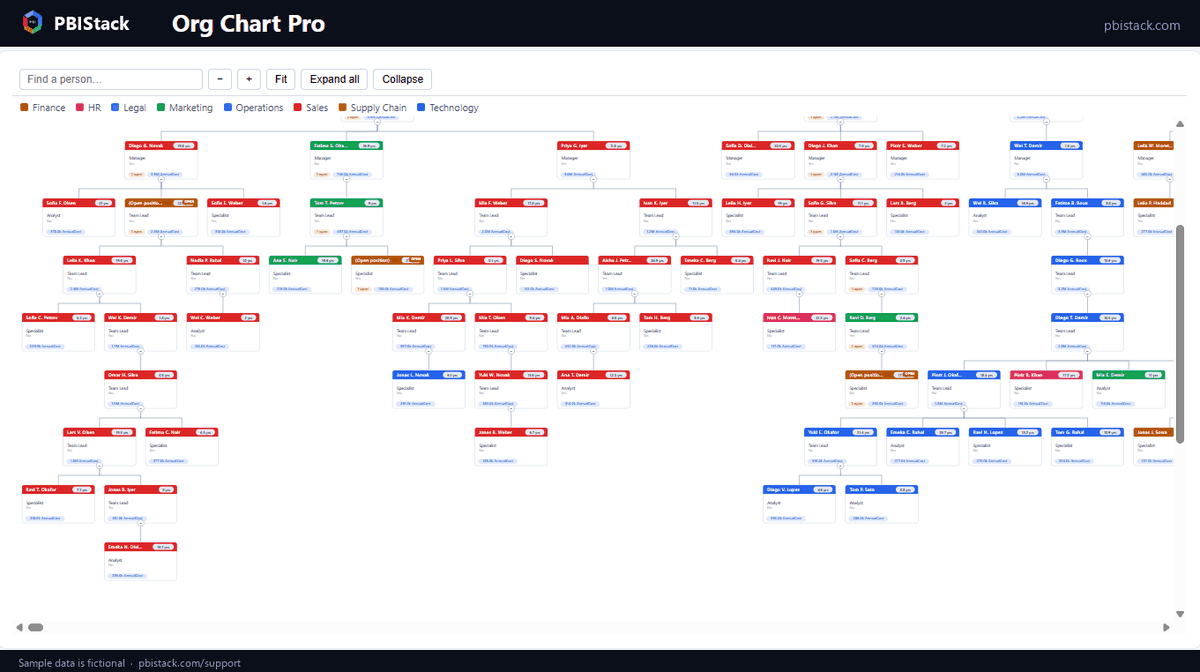
Organization charts that never overlap — with photos, open positions, dotted-line reporting, tenure and cost rollups, and honest reporting when HR data is broken instead of silently dropping people.
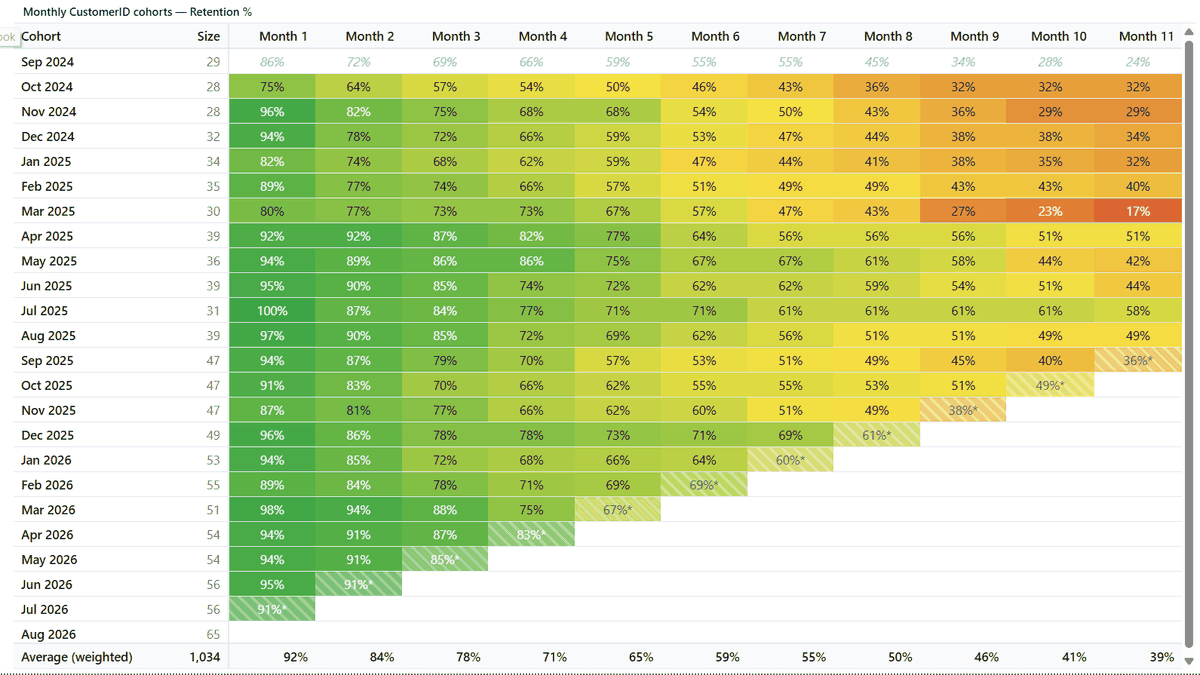
Retention and churn cohort analysis natively in Power BI — the triangle chart Mixpanel and Amplitude users know, computed live from your own model.
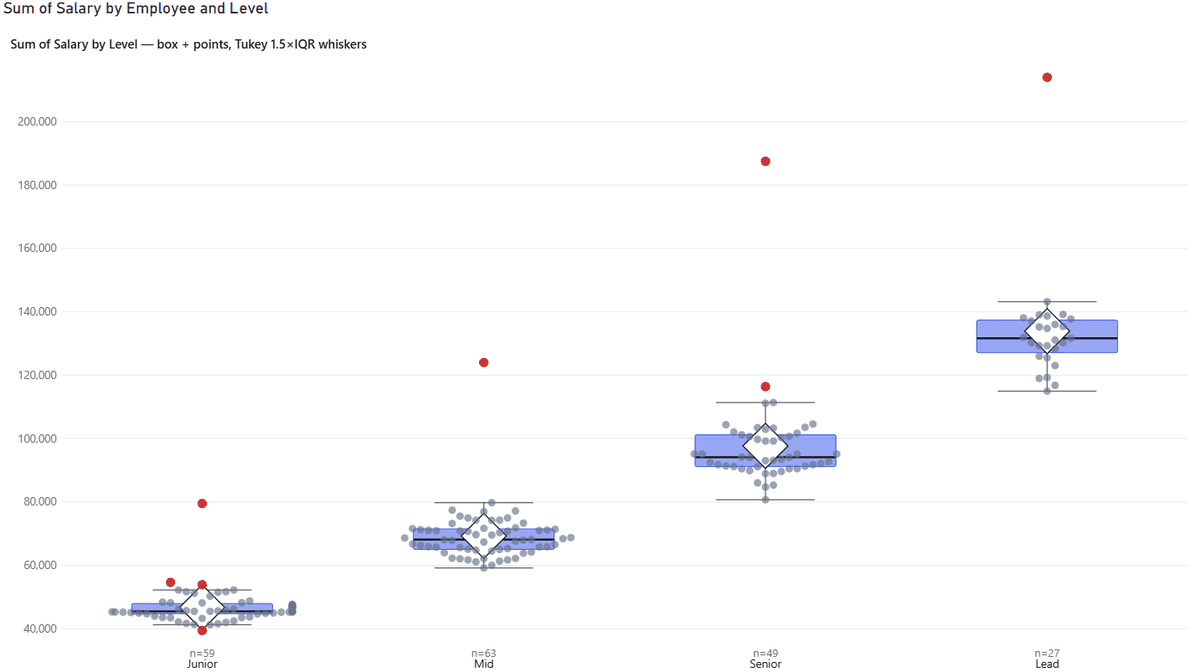
Box plots, violins, beeswarm, histogram and a correlation matrix in one visual. Quartiles that match Excel exactly, real kernel density, and no silent sampling.
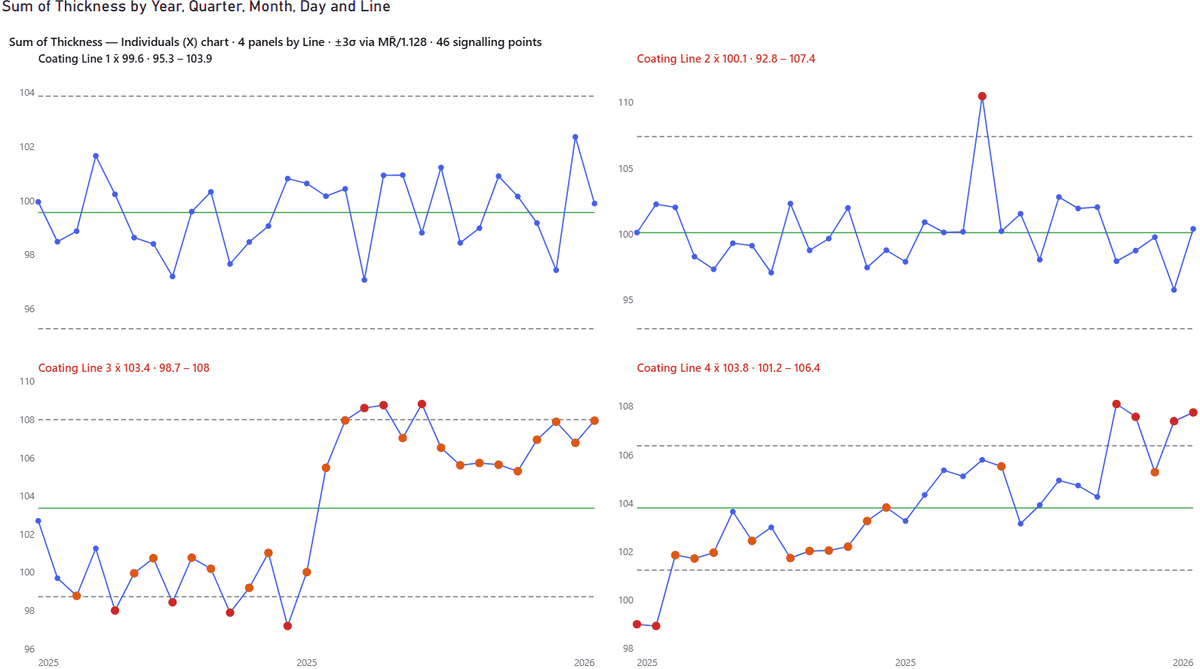
SPC control charts as small multiples: XmR, P, C and U charts with limits recalculated inside every panel, Nelson and NHS rules, and rebasing on step change.
The radar chart that starts at zero, labels its rings, and gives every axis its own scale — plus targets with the gap drawn for you, and axes that stay pinned through slicers.
Power BI keeps 30 days of usage history and gives you no alerts. TenantWatch keeps all of it, in your own tenant, and tells you when something breaks — retained history, refresh and sharing alerts, wasted-spend detection. Runs on Power BI Pro, no Premium required.
The difference
Most visuals quietly drop the rows they can’t handle. Ours name the problem, in plain language, and keep every record on the chart.
Built for scale
We load beyond Power BI’s default row window and draw only what’s on screen — so a ten-thousand-row visual pans as smoothly as a ten-row one.
Licensing
Report viewers never need a licence, an account, or a sign-in — the visual is part of your report. Nothing calls out to us, so there is nothing to block, whitelist or audit.
Everything runs inside the report. No telemetry, no service dependency, no data leaving your tenant.
Licence the authors who build reports. Distribution to readers is unlimited and free.
No Premium capacity required for any of the six visuals.
Questions, pricing, early access, or a feature you need — one inbox, answered within two business days. All six visuals are on their way to AppSource — Org Chart Pro first.