Custom visual
Pro Table Coming to AppSource
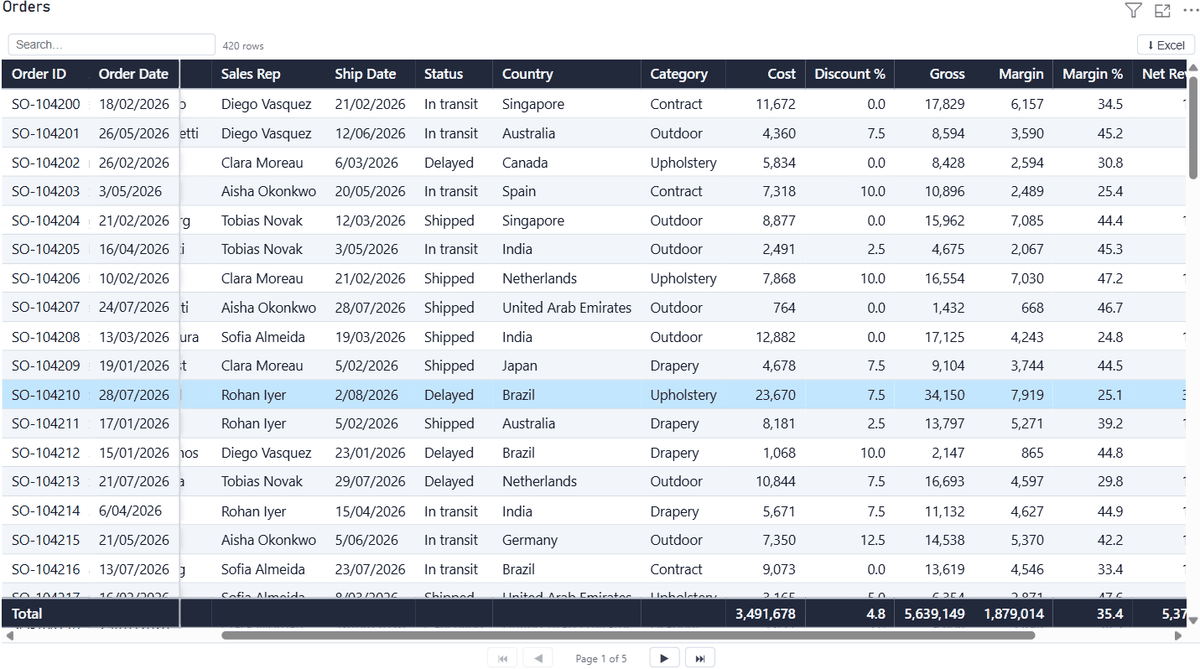
The built-in Power BI table stops where real reports begin. Pro Table adds the features analysts keep asking for — frozen columns, sticky totals, pagination, search, per-column control and Excel export — in one fast, native-feeling visual.
Straight to the point: what it does · what it doesn’t
Features
- ●Frozen columns. Keep key columns in view while scrolling wide tables horizontally.
- ●Sticky totals. A totals row that stays pinned while you scroll — top or bottom, styled independently. Row totals available too.
- ●Pagination. Any page size you type — no dropdown limits. Large tables stay fast and readable.
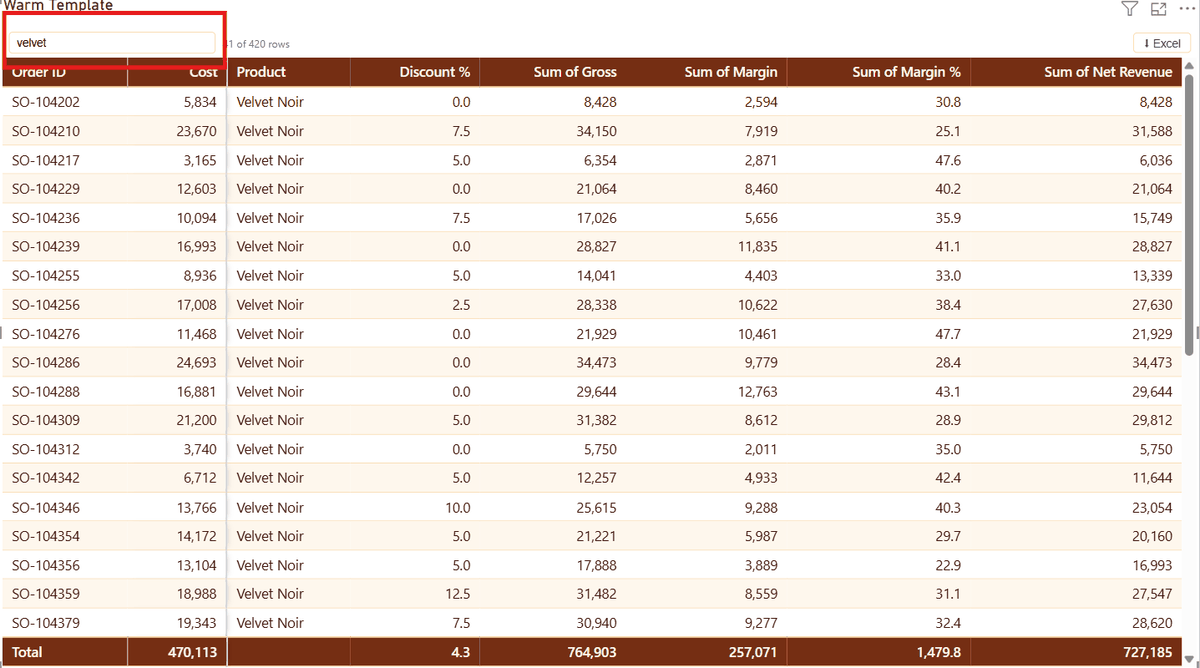
- ●Search. Instant text search across the whole table, right in the visual.
- ●Multi-column sort. Sort by several columns at once; sort survives field changes because it is bound to the column, not its position.
- ●Per-column formatting. Pick a column in “Apply settings to” and give it its own alignment, width, colors and number formatting — without touching the rest.
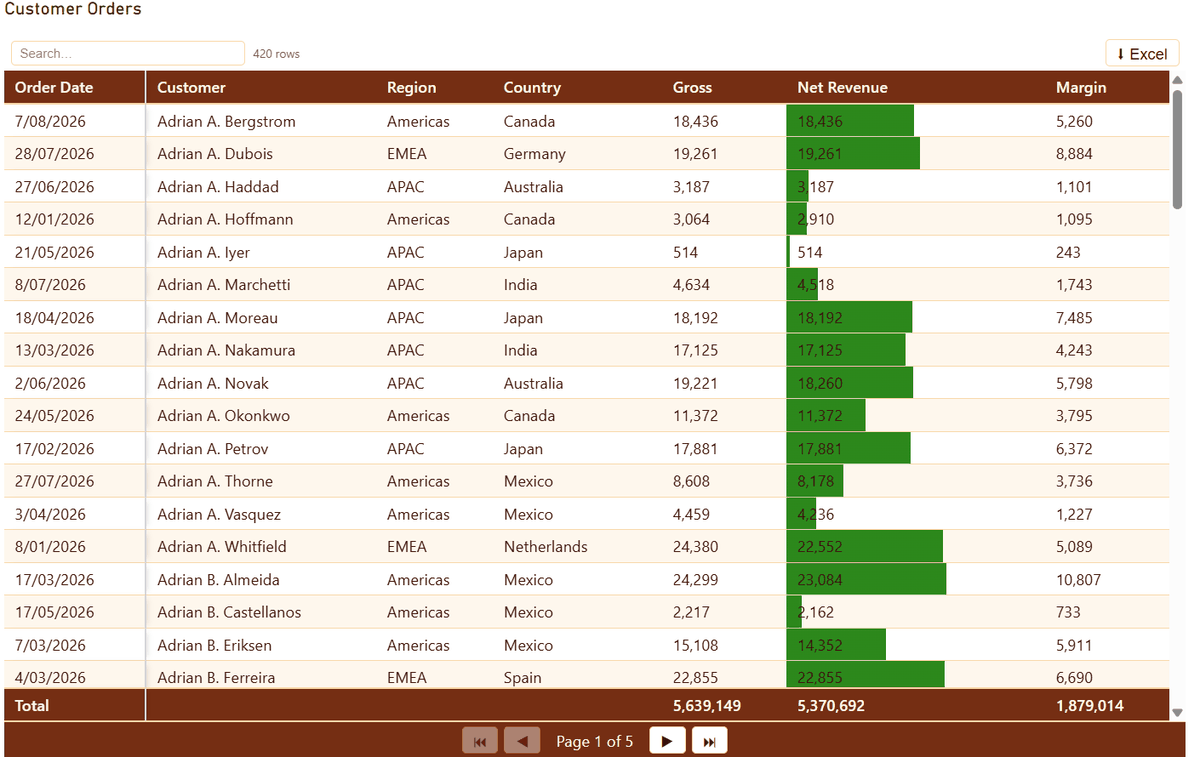
- ●Conditional formatting. Rule-based backgrounds and font colors per column, configured inside the visual.
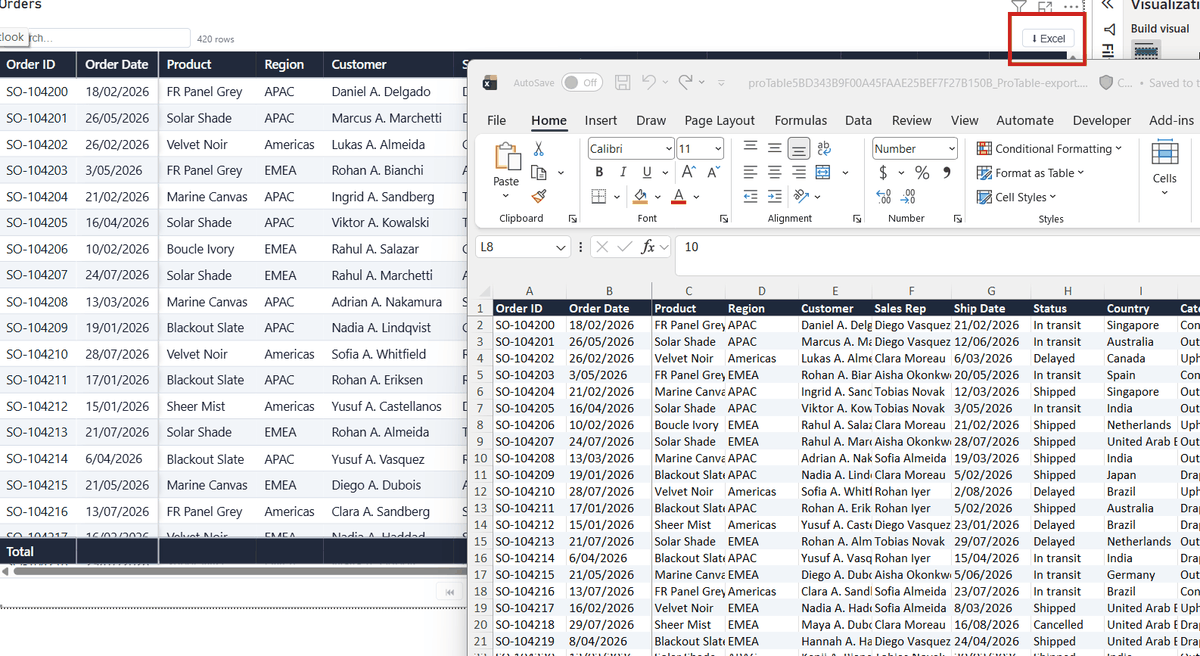
- ●Excel export. One click downloads the table as a real .xlsx file — respecting current filters and sort.
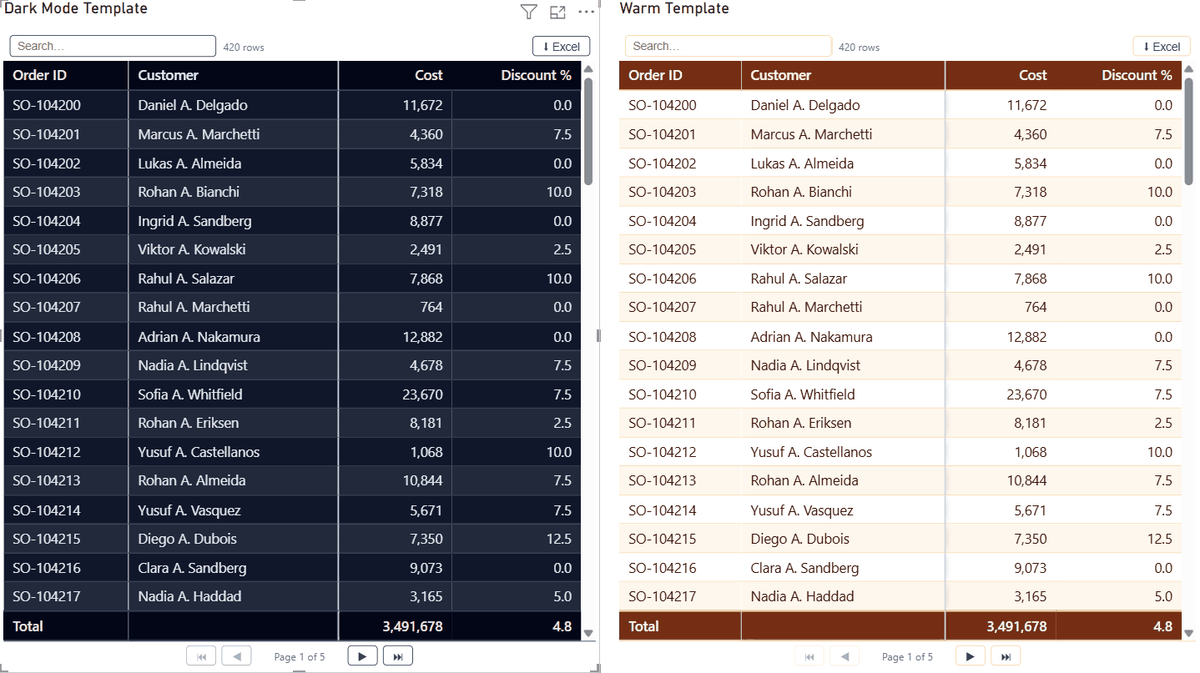
- ●Ten style presets. Clean, Banded, Excel Blue, Ledger, Indigo, Navy, Teal, Graphite, Night and Boardroom — each a whole system (density, header treatment, gridlines, totals), applied in one click and still overridable afterwards.
- ●First-class Power BI citizen. Cross-filtering in both directions, drag-to-resize columns, respects report themes, handles large models via progressive loading.
Honest limitations
We would rather you know these before you buy than after.
- Excel export needs tenant permission. A Fabric administrator must enable Admin portal → Tenant settings → Power BI visuals → “Allow downloads from custom visuals”. It is off by default in every tenant and is separate from your general export and sharing settings. Without it Power BI blocks the download — and Pro Table tells you which switch to ask for rather than failing silently.
- An empty visual can’t be dragged by its body. Until fields are added, move it by its header strip — a Power BI host behavior that affects table-style visuals.
- Very large results load progressively. Data arrives in segments (a Power BI mechanism); a loading indicator shows until the table is complete.
Learn it in ten minutes
The Pro Table tutorial walks through every feature with a sample dataset — from first drag-and-drop to conditional formatting and export.
Questions about Pro Table?
Pricing, a feature you need, whether it fits your model — ask, and a person who wrote it answers within two business days. It is in AppSource certification now.