Tutorial
Pro Table in ten minutes
From first drag-and-drop to a boardroom-ready table: theming, per-column control, conditional formatting, sorting, search, cross-filtering and Excel export.
1. Quick start
- Add the visual to a report page and drop in your columns and measures.
Any mix of dimensions and measures works; the table renders instantly with sensible defaults.
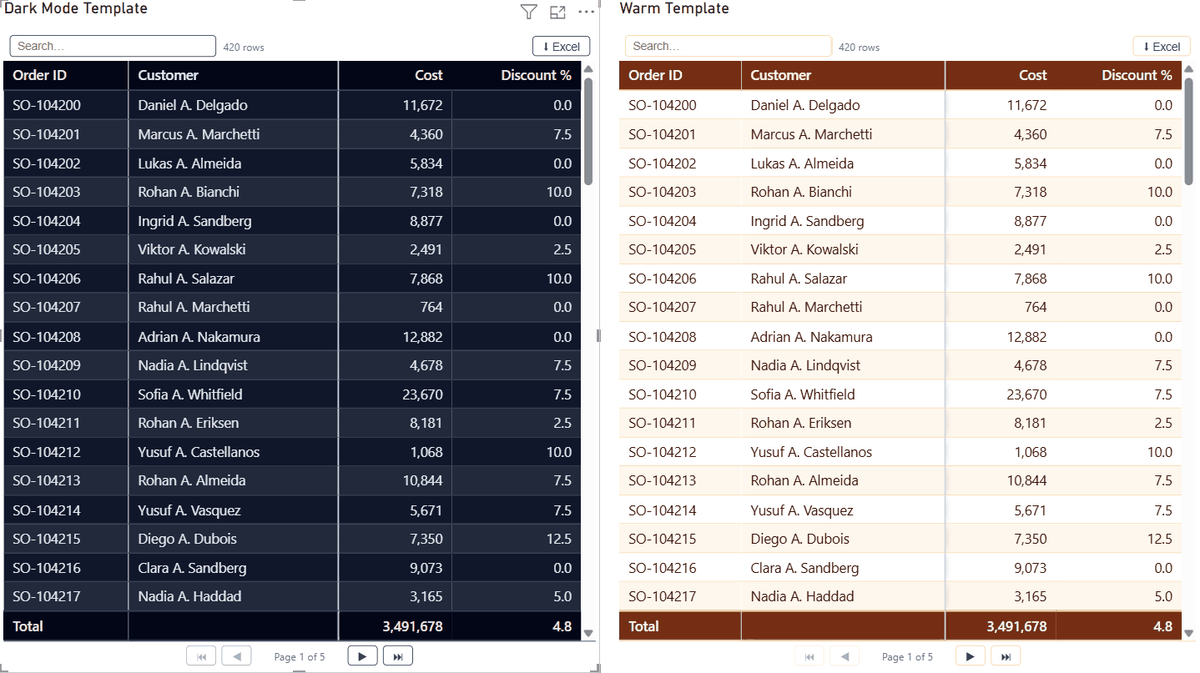
- Pick a style preset. Format pane → Style presets. The table opens in Clean;
try Excel Blue, Ledger or Night.
Each preset is a complete design — density, header, gridlines and totals, not just colours. Everything a preset sets can still be overridden afterwards — presets are a starting point, not a cage.
- Set your page size. Layout → Rows per page — type any number.
Pagination keeps huge tables fast and printable.
2. Freeze, stick, scroll
Frozen columns (Layout → Frozen columns) pin the first N columns while the rest scroll horizontally — keep the customer name in view across forty measure columns. Totals stay pinned while you scroll vertically, top or bottom, with their own styling (background, font, border) so they read as a summary, not just another row. Row totals add a right-hand total across measures.
3. Per-column control
Most table visuals force one style on every column. Pro Table's format cards have an “Apply settings to” dropdown: choose All columns to set the baseline, then choose a specific column and override just that one — alignment, width, colors, number format. The measure gets right-aligned currency; the status column gets centered text; nothing else moves.
4. Conditional formatting
Rule-based background and font colors per column — thresholds for margins, red negatives, highlight top performers. Rules are configured in the format pane and travel with the report. Combined with per-column settings, you can reproduce most “Excel report” looks people miss in Power BI.
5. Sort, search, filter
- ●Multi-column sort: click a header to sort, click again to reverse; additional columns stack into the sort order. Sorting is bound to the column identity, so it survives adding or removing other fields.
- ●Search: the search box filters rows as you type, across all visible columns.
- ●Cross-filtering: click a row or cell to filter the rest of the page; Ctrl-click for multi-select; click empty space to clear. Incoming filters from slicers and other visuals work as expected.
6. Excel export
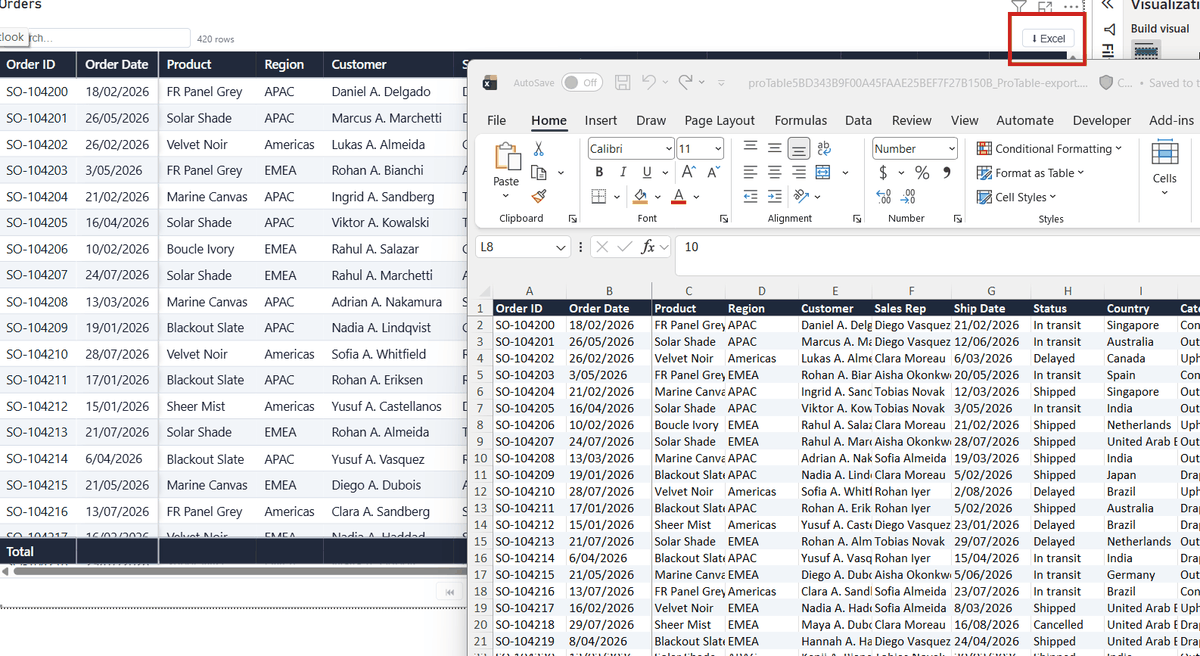
The export button downloads the current table — current filters, current sort — as a
real .xlsx file. First time only: your Power BI admin must allow
downloads from custom visuals (Admin portal → Tenant settings → “Allow downloads
from custom visuals”). If exports are blocked, that setting is why.
7. Good to know
- Empty visual: until fields are added, Power BI only lets you move the visual by its header strip — add data and body-dragging works normally.
- Very large tables load in segments with a progress indicator; interactions stay live while the rest streams in.
- Column widths you drag are kept for the session; saved report widths come from the format pane settings.
Something not covered here?
Ask — the answer usually ends up back in this tutorial.